Week 3 Project
1. Cleaning Dataset:
1.1. Initial Inspection and Data Cleanup:
- First impression, the dataset looks clean, no missing value, no messy format.
- Select all -> Data-> Data clean up -> trim the white spaces.
- Repeat step -> Data -> Data Clean Up-> remove duplicates.
1.2. Data Type Formatting:
- Check schemas and see two columns related: total spend and frequency purchases. -> adding two new columns: one named Customer Lifetime Value, another one is ROI – Return Of Investment.
- At the first row of the dataset, at the first cell of the column “Customer Lifetime Value”, enter the formula = total_spend * frequency_purchases.
- At the first row of dataset and at the first cell of column “ ROI” , enter the formula = roundup(((total_spend – marketing_ spend)/ total_spend)*100,1)
- Next, drag out the results from the first row of both columns.
- Then, Formatting columns Total_spend, marketing_spend, customer_ Lifetime_Value as the currency; Formatting the column ROI by percentage.
- Condition Formatting of the column “Customer Lifetime Value “ -> Condition: greater and/or equal to the formula average of all cells from the column “Customer Lifetime Value “ -> add-on color Formatting when the conditions are met.
1.3. Export: The cleaned dataset was exported as a CSV file.
1.4 Cleaned dataset sample:
| Customer_ID | Customer_Name | Region | Total_Sales | Purchase_Frequency | Customer Lifetime Value | Marketing_Spend | ROI by percentage | Seasonality_Index | Churned |
|---|---|---|---|---|---|---|---|---|---|
| 101 | John Doe | North | 5000 | 12 | 60000 | 2000 | 150 | 1.2 | No |
| 102 | Jane Smith | South | 3000 | 8 | 24000 | 1500 | 100 | 1 | Yes |
| 103 | Sam Brown | East | 4500 | 10 | 45000 | 1800 | 150 | 1.1 | No |
| 104 | Linda Johnson | West | 2500 | 5 | 12500 | 1000 | 150 | 0.9 | Yes |
| 105 | Michael Lee | North | 7000 | 15 | 105000 | 2500 | 180 | 1.3 | No |
| 106 | Emily Davis | South | 3200 | 7 | 22400 | 1400 | 128.6 | 1 | Yes |
| 107 | David Wilson | East | 5300 | 14 | 74200 | 2300 | 130.5 | 1.2 | No |
| 108 | Susan White | West | 2900 | 6 | 17400 | 1100 | 163.7 | 0.8 | Yes |
| 109 | Chris Martin | North | 6000 | 13 | 78000 | 2200 | 172.8 | 1.2 | No |
| 110 | Anna Taylor | South | 3100 | 8 | 24800 | 1350 | 129.7 | 0.9 | Yes |
| 111 | James Anderson | East | 4700 | 11 | 51700 | 1900 | 147.4 | 1.1 | No |
| 112 | Patricia Thomas | West | 2600 | 5 | 13000 | 1050 | 147.7 | 0.8 | Yes |
| 113 | Robert Jackson | North | 5500 | 12 | 66000 | 2100 | 162 | 1.2 | No |
| 114 | Mary Harris | South | 3300 | 9 | 29700 | 1450 | 127.6 | 1 | Yes |
| 115 | Daniel Clark | East | 4900 | 11 | 53900 | 2000 | 145 | 1.1 | No |
| 116 | Barbara Lewis | West | 2700 | 6 | 16200 | 1150 | 134.8 | 0.9 | Yes |
2. Insights:
Short Summary:
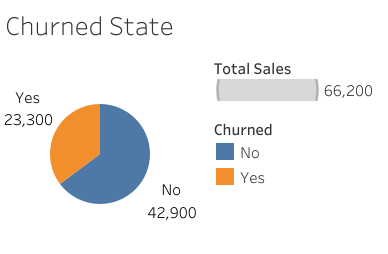
- Total sales across region = $ 66200
- Total marketing spend = $ 26800
- Customer Acquisition Cost = $ 1675
- Median frequency of purchase is 9 months 2 weeks long.
2.1 Regions Situation:
- The North region exhibits the highest average ($5,875) with the frequency purchase of 13 months long -> as result, the customer lifetime value reaches $77,250.
- Conversely, the South and West regions show comparatively lower average
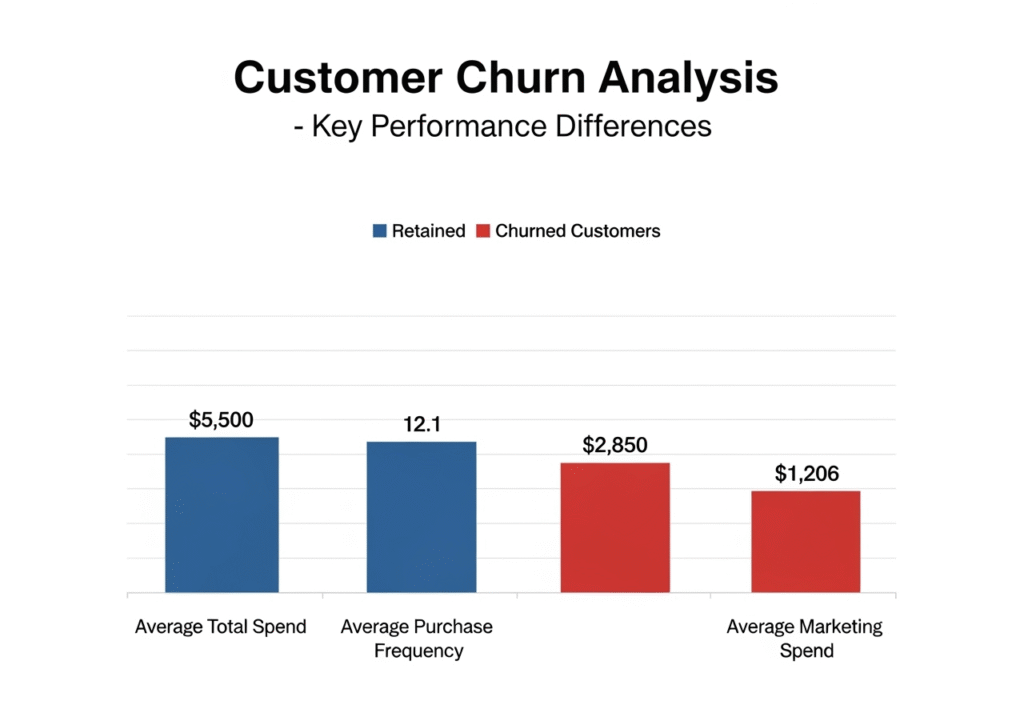
2.2 Customer Retention:
- Both the North and East regions exhibit a 0% churn rate, indicating high customer satisfaction and retention.
- In stark contrast, the South and West regions both demonstrate a 100% churn rate, highlighting significant customer retention challenges.
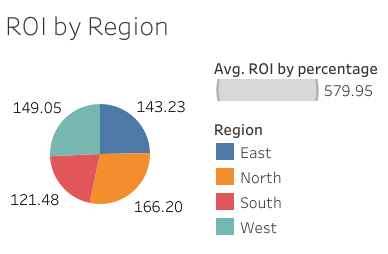
2.3 ROI Situation
- The North region has the highest ROI of 166.15%
- The West region also has a lower average ROI of 149% and the lowest average marketing spend $1,075.
- The South region has the lowest average ROI of 121.45% and lowest marketing spend $1,425 -> suggesting that current marketing efforts may be less effective or insufficient in this region.
3. Visualizations:
3.1 Current Customer Retention Situation
3.2 Current ROI by Region
3.3 Current Pattern

3.4 Current CLV – Customer Lifetime Value

3.5 Current Situation of 3 Variants: Total Spend, Marketing Spend and ROI

Recommendations
Deeper the current situation analyzing
-> focus on business domains:
- Business Capability
- Current Inventory
- Marketing Budget and Strategy
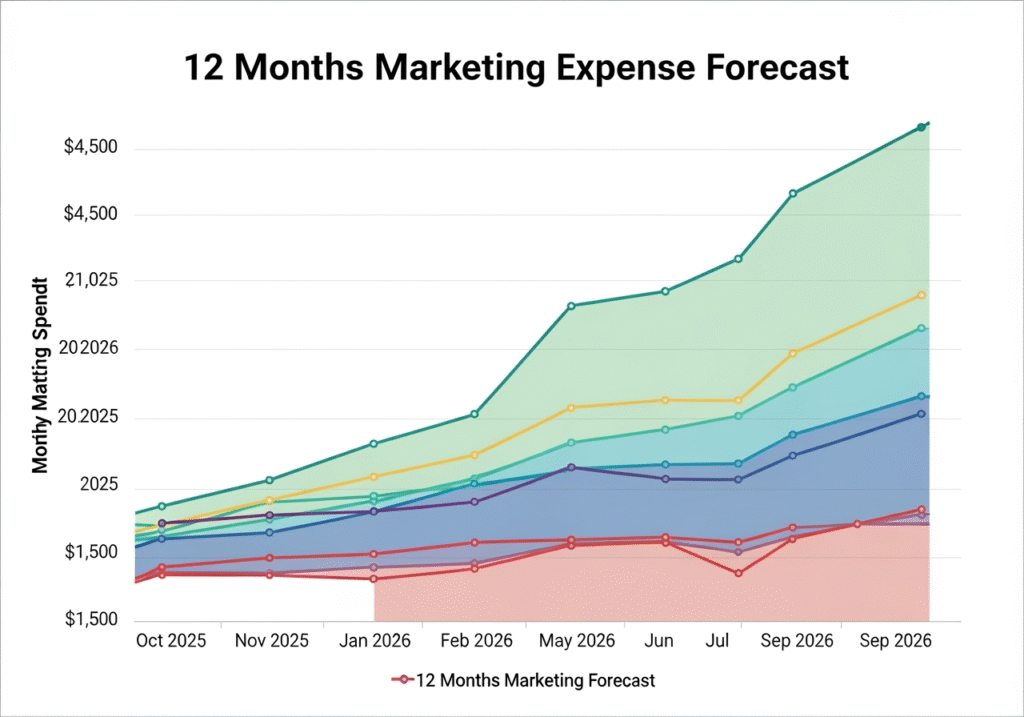
Making the forecast based on the historical data as the baseline reference point:
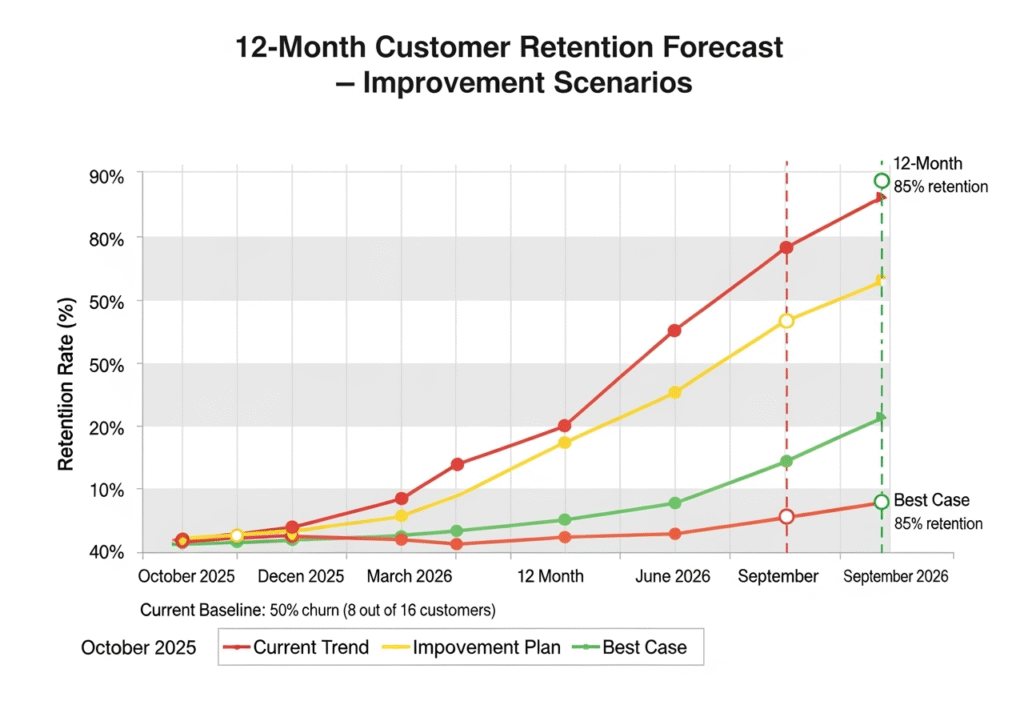
Forecasting Customers Retention
Forecasting Marketing Spend