
Week 1 project
Context and Scenario:
As a Data Analyst for Shop Ease, an online retail company, the objective is to enhance sales performance and customer satisfaction through comprehensive analysis of sales data.
1. Cleaning Dataset:
1.1. Initial Inspection and Data Cleanup:
- The dataset was manually uploaded to Excel, and its schema, columns, and rows were meticulously inspected. An empty cell was identified at H2.
- The entire dataset underwent data cleanup, involving the removal of duplicate entries and the trimming of white spaces.
1.2. Data Type Formatting:
- The “total_amount” column, identified as containing manual input, was formatted to ensure all cells were numeric rather than string type.
- The “Date” column was formatted to display as “Friday, May 18, 2024.”
1.3. Calculation:
- The empty cell H2 was populated with the formula “=F1*G1” to calculate the total amount (quantity x unit price). This formula was subsequently applied to the remainder of the column.
1.4. Export: The cleaned dataset was exported as a CSV file.
1.5 Cleaned dataset sample:
| Transaction_ID | Date | Customer_ID | Product | Category | Quantity | Price | Total_Amount | Payment_Method | Region |
|---|---|---|---|---|---|---|---|---|---|
| 1001 | Friday, January 5, 2024 | C001 | Laptop | Electronics | 1 | 800 | 800 | Credit Card | North |
| 1002 | Wednesday, January 10, 2024 | C002 | Smartphone | Electronics | 2 | 600 | 1200 | Cash | South |
| 1003 | Friday, January 12, 2024 | C003 | Headphones | Electronics | 1 | 100 | 100 | PayPal | West |
| 1004 | Monday, February 5, 2024 | C004 | Tablet | Electronics | 1 | 500 | 500 | Debit Card | East |
| 1005 | Thursday, February 8, 2024 | C005 | Book | Books | 3 | 20 | 60 | Credit Card | North |
| 1006 | Saturday, February 10, 2024 | C001 | Laptop | Electronics | 1 | 800 | 800 | Credit Card | North |
| 1007 | Friday, March 15, 2024 | C006 | Shoes | Clothing | 2 | 50 | 100 | Cash | South |
| 1008 | Monday, March 18, 2024 | C007 | T-Shirt | Clothing | 1 | 25 | 25 | PayPal | West |
| 1009 | Wednesday, March 20, 2024 | C008 | Smartwatch | Electronics | 1 | 200 | 200 | Debit Card | East |
| 1010 | Monday, April 1, 2024 | C009 | Book | Books | 2 | 20 | 40 | Credit Card | North |
| 1011 | Friday, April 5, 2024 | C002 | Smartphone | Electronics | 2 | 600 | 1200 | Cash | South |
| 1012 | Wednesday, April 10, 2024 | C010 | Tablet | Electronics | 1 | 500 | 500 | Debit Card | East |
| 1013 | Wednesday, May 1, 2024 | C011 | Shoes | Clothing | 1 | 50 | 50 | Cash | South |
| 1014 | Sunday, May 5, 2024 | C012 | Headphones | Electronics | 1 | 100 | 100 | PayPal | West |
| 1015 | Wednesday, May 8, 2024 | C013 | Laptop | Electronics | 1 | 800 | 800 | Credit Card | North |
| 1016 | Friday, May 10, 2024 | C014 | T-Shirt | Clothing | 3 | 25 | 75 | Cash | South |
| 1017 | Saturday, June 1, 2024 | C015 | Smartwatch | Electronics | 1 | 200 | 200 | Debit Card | East |
| 1018 | Wednesday, June 5, 2024 | C016 | Book | Books | 4 | 20 | 80 | Credit Card | North |
| 1019 | Saturday, June 8, 2024 | C017 | Smartphone | Electronics | 1 | 600 | 600 | Cash | South |
| 1020 | Monday, June 10, 2024 | C018 | Tablet | Electronics | 1 | 500 | 500 | Debit Card | East |
2. Insights:
Summary:
- Total Sales from all categories products combined of all Regions are 31 sales which brings back the profit of $7930.
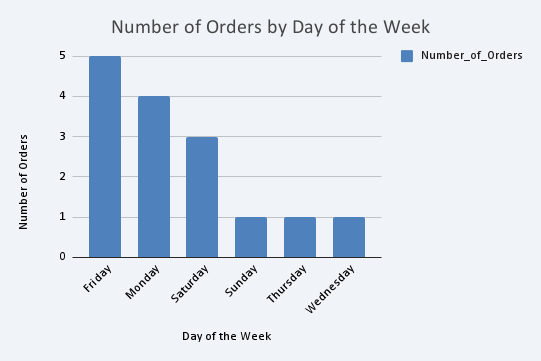
- Mid-week and end-of-week exhibit peak order activity, with Wednesday being the most popular day for placing orders, accounting for 6 recorded orders.
- May recorded the highest number of orders, totaling 4
- Electronics emerged as the best-selling category for Q1 and Q2, with 15 orders over a six-month period, contributing 95% of the total profit (valued at $7500).
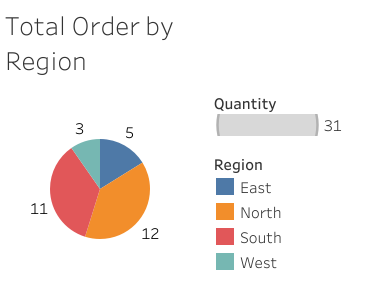
- The North Region demonstrates the highest volume of product exports, followed by the South Region.
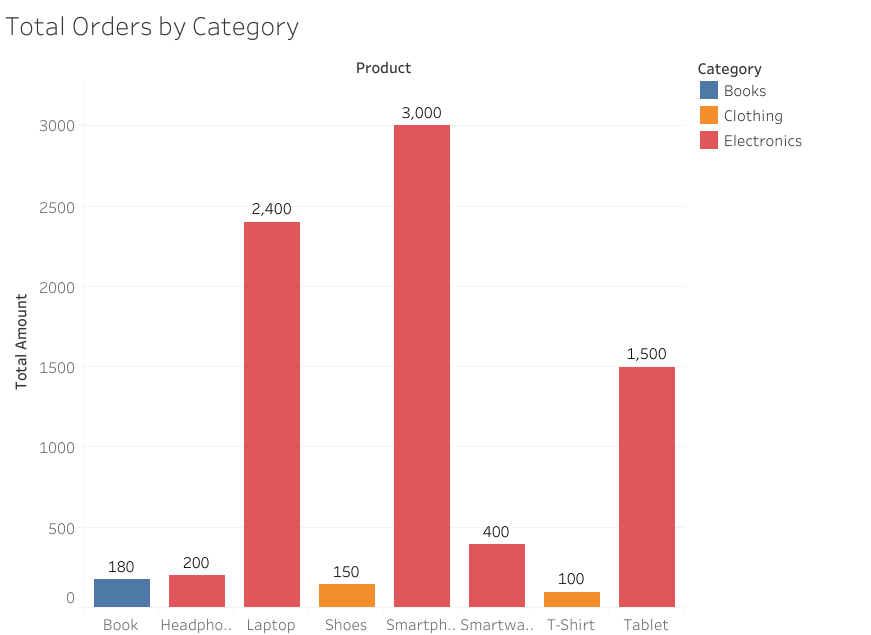
2.1 Dominance of Electronics in Sales:
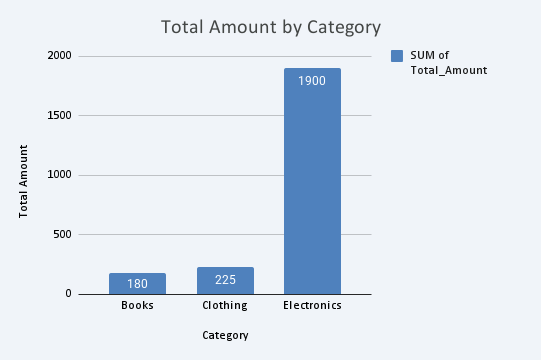
- Electronics is by far the highest-grossing category, generating a total of $7,500 in sales. Within Electronics, ‘Smartphone’ and ‘Laptop’ are the top-performing products, contributing $3,000 and $2,400 respectively.
- This significantly overshadows other categories, with Books at $180 and Clothing at $250.
2.2 Regional Sales Distribution
- The South region leads in total sales with $3,225, followed closely by the North region at $2,580.
- The East region shows moderate sales of $1,900, while the West region has the lowest sales at $225.
2.3 Preferred Payment Methods:
- ‘Cash’ is the most frequently used payment method, accounting for $3,225 in sales.
- ‘Credit Card’ is the second most popular method, with sales totaling $2,580.
- ‘Debit Card’ and ‘PayPal’ are used less frequently, contributing $1,900 and $225 respectively.
3. Visualizations:
3.1. Total Sales by Category:
3.2. Total Sales by Region
3.3. Sales by Category and Region:
3.4. Sales by Day of the Week:
Recommendations
Given that February, March, and May represent the months with the lowest sales, a meeting with stakeholders is proposed. The workshop, approximately two hours in duration and conducted online, aims to achieve the following:
1. Product Elicitation: Elicit potential new products in the book and clothing categories for add on over the next 3 months.
2. Product Prioritization: Brainstorm, prioritize, and verify decisions regarding new product additions for each quarter.
3. Strategy Review and Future State Definition: Review the current internal and external business state -> define the future state for the remaining six months of 2024, and, if time permits, predict market volume for Q1 of 2025.
4. Marketing Strategy Review: Review the current marketing strategy and propose necessary changes or improvements.